|
Johnny Appleseed
|
|
|
Group: Forum Members
Posts: 15,
Visits: 32
|
I have a single log file open, and:  Why?
|
|
|
|
|
Johnny Appleseed
|
|
|
Group: Forum Members
Posts: 15,
Visits: 32
|
I'd post a screenshot of the about screen, but the app is essentially frozen, so I can't. It's the latest version as of this post.
(I wanted to add this to my original post, but the forum wont let me edit it)
|
|
|
|
|
LogViewPlus Support
|
|
|
Group: Moderators
Posts: 1.3K,
Visits: 4.6K
|
Hi Johnny,
Thanks for reporting this issue.
LogViewPlus stores two copies of every log entry in memory as UTF-16 (a parsed and unparsed version) and this makes it a memory intensive application. In other words, I would expect a 1 GB ASCII log file to take up 4 GB in memory once parsed. We have some ideas on how to decrease this footprint in future, but these changes are still several months out.
Some of the memory used to parse a log file will not be released after the log files is closed. So the behavior you are seeing could be caused by a combination of:
1. Opening a lot of large files.
2. Not restarting the application occasionally.
I would be happy to look into this issue further, but it is not clear from the screenshot above how the application is being used, or what memory is actually being consumed by LogViewPlus. Can you please provide more information?
Thanks again,
Toby
|
|
|
|
|
Johnny Appleseed
|
|
|
Group: Forum Members
Posts: 15,
Visits: 32
|
ty for the quick reply. Here's the log file I'm using if it helps: [ Edit: Removed ] I'm not sure what you mean by "what memory is actually consumed?" I just dragged the file onto the LVP window and accepted the default parsing option. Seems like having 2 copies of every open file is very inefficient in terms of having several (or many) log files open at once. Especially if they're also tailing live updates, and the pretty UI, which i assume is pretty memory chunky alone (but I do love it's appearance and is one of the reasons I chose it). I just purchased 32GB of ram, up from 16 due to always running out of memory with docker running, and now a log viewer is eating almost half of it, lol.
|
|
|
|
|
LogViewPlus Support
|
|
|
Group: Moderators
Posts: 1.3K,
Visits: 4.6K
|
Thanks for the sample log file - that is always very helpful. :-) I have updated your post to remove the link for now. For anyone else reading this thread, the important thing to note is that the file is a 1 GB text file with JSON data. On my machine, this file is running in line with expectations and consuming about 3.7 GB of memory: 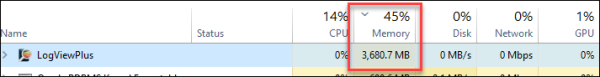 I agree there is some inefficiency here. This is something that we have spent a lot of time investigating and trying to improve, but the bottom line is that: 1. Converting from ASCII or (most) UTF-8 to UTF-16 is required by the .Net framework and will double the memory size. 2. Keeping a parsed and unparsed version is necessary to support different filter and analysis scenarios supported by the application. LogViewPlus has been using the same memory model for a few years. There have been some updates to the application which should enable some changes which would dramatically improve the memory profile for most users. Unfortunately, these changes are still several months out. Back to the problem: Why am I showing 3.6 GB and you are showing 13.6 GB? I can think of two possible reasons: 1. The application may have had several files open prior to opening this log file. LogViewPlus uses string interning, which means that not all memory is cleaned up after a log file is closed. Normally, this is not an issue, but problems can arise if users are opening multiple large files. We can look into disabling this in the next release. 2. Because this is a JSON file with lots of small bits of data, there is a lot of memory used during parsing. This usage should be reclaimed after the file is loaded. Maybe garbage collection is not running correctly for some reason? Garbage collection is triggered by the OS and not the application. Sometimes the OS can make "strange" decisions about when to try and collect. As an interim solution, I would recommend either restarting LogViewPlus as it reaches the memory threshold or looking into Partial Opens. Hope that helps, Toby
|
|
|
|
|
Johnny Appleseed
|
|
|
Group: Forum Members
Posts: 15,
Visits: 32
|
I appreciate your editing out the log file. I usually don't like posting those, but did so in this case.
Part of the reason it may have used more mem on my machine is that before I gave you the link to the log I went through and mass replaced a fair amount of text with a lesser number of asterisks (for redaction). It still probably wasn't *that* much though in terms of being simple text and modern PC's.
In this particular case I hadn't had any other logs open before it; I had just opened this one log and let it stay open overnight while I slept, and happened to notice how much mem it was using the next morning when I was trying to figure out why it's UI was so unresponsive, and took a look at the task manager. Memory leak maybe?
I'm curious, when you first load the file on your end, how long before the ui was responsive?
For reference, the machine I was running it on isn't a dog. It's a Ryzen 5 1600 overclocked, with 32gb of high performance gaming ram. I used to play some high end intensive games on it before upgrading my main machine and using that one as a server for docker.
I'm not a coder, so I'm just thinking outloud here, but is there some way to perhaps use compression on the files open in mem, and decompress bits and pieces as needed? Memory compression on the fly, or something similar.
|
|
|
|
|
LogViewPlus Support
|
|
|
Group: Moderators
Posts: 1.3K,
Visits: 4.6K
|
Hi Johnny,
On my machine, it takes about 40 seconds to open your log file.
Thanks for the additional information. I can experiment with some of the additional details you provided to see if I can recreate the issue on my end. It sounds like you were monitoring a remote file overnight in tail mode. I assume the file was not rolled or recreated.
It is also worth noting that refreshing a log file is the same as closing and reopening it. I wonder if your log file was refreshed overnight for some reason (maybe a log roll event?).
Compression can impact memory, but again - this memory should be collected. The only significant long term memory should be the log entries.
Thanks,
Toby
|
|
|
|
|
Johnny Appleseed
|
|
|
Group: Forum Members
Posts: 15,
Visits: 32
|
Hi
Regarding the log being rolled or refreshed, it shouldn't have been. That's a separate issue I've been working on is to have the nextcloud container stop creating such enormous log files and roll them at around 5 or 10 mb instead. I *think* I have that taken care of, but it's still in the test phase. I do have to say that on smaller log sizes LVP runs great. =)
I suppose my biggest 'concern' is not really about how it performs with 1 massive log file open, since that can sort of be mitigated with rolling them in smaller sizes; but more of what might happen if I'm trying to monitor several log files at a time for debugging purposes and the total amount ends up around that 1gb+ size; I'm assuming it would still make LVP unusable due to an unresponsive UI. And I find myself working with many open log files very very frequently. Up until now I've been using VSCode to watch several logs at once, but it doesn't have all the pretty column parsing, and so forth that make it much easier to read a log. It seems to handle large and multiple files w/out issue, but again, most likely due to not really doing much parsing other than syntax highlighting.
Also just to address one thing you said, it was a local file (rather than remote). I have that log file mounted in docker so that it writes it out to a local folder, and then I just used LVP to open that local file, though yes, the container was still running all night so new items were being added (tailed). So there should be any 'overhead' in terms of maintaining a tcp connection, or anything of that nature.
Regarding mem compression, I was thinking more along the lines of compressing the actual text of the file in memory (rather than overall memory compression and reclamation). Sort of like having the log file "zipped" in memory, and you temporarily "unzip" the bits and pieces needed at the moment; for instance, to display in the table, and then recompress it as needed as well. It sounds like that could lead to a lot of cpu or what not, but with the powerhouse PCs we have these days, maybe it wouldn't be noticeable. Anyway, again, no idea if that's even possible so I'm just throwing ideas out into the ether, lol.
Apologies for the long read, I just like to give devs as much info as possible so maybe they can glean out the parts they find useful. =)
|
|
|
|
|
LogViewPlus Support
|
|
|
Group: Moderators
Posts: 1.3K,
Visits: 4.6K
|
Thanks for the clarification Johnny. Not sure where I got 'remote' from. :-)
Given the memory you have available, you should be able to open a 1 GB file and work with it. The issue here is the amount of memory consumed after an extended period of time. It is not yet clear why the memory is spiking, but I am not sure you should be concerned about just opening and working with a large amount of data. I am able to do this locally without issue. I think the problems discussed here are more likely due to the accumulation of actions taken throughout the day.
There are several things we can do with memory management which will effectively be a trade-off of less memory for more CPU similar to the memory compression idea (a good one! :-). Currently, we aim to save CPU cycles, but we will be revisiting this soon.
LogViewPlus consumes memory when opening and parsing the log file. There is a lot of work that happens here and a lot of excess memory may be allocated which can then be reclaimed. After parsing, everything else done by the application should be pretty trivial from a memory perspective.
Hope that helps,
Toby
|
|
|
|
|
Johnny Appleseed
|
|
|
Group: Forum Members
Posts: 15,
Visits: 32
|
Ok, TYVM, I'm just happy that I reported it and you're now aware of it. =) If you'd like me to beta test any relevant changes, I'd be happy to. One quick question (or request if it doesn't already exist): many similar log viewers or other apps (one example coming to mind is Discord) will have a feature that draws a horizontal line between where you left off since last viewing:  I guess maybe it just monitors if the window/tab has focus. That would be super handy when viewing logs as well, if it drew a line across the row above where you left off, so it's much faster to get your bearings when you come back.
|
|
|
|