Java GC Analysis
Java garbage collections can have big performance implications. LogViewPlus can analyze GC log files and highlight issues in seconds.

Analyze a Java GC log file in seconds. (1:48)
LogViewPlus has built-in reports to help you analyze your Java GC log files. Our core reports show information such as collections over time, pause times and memory used vs reclaimed. Want to go deeper? Create your own custom reports using SQL.
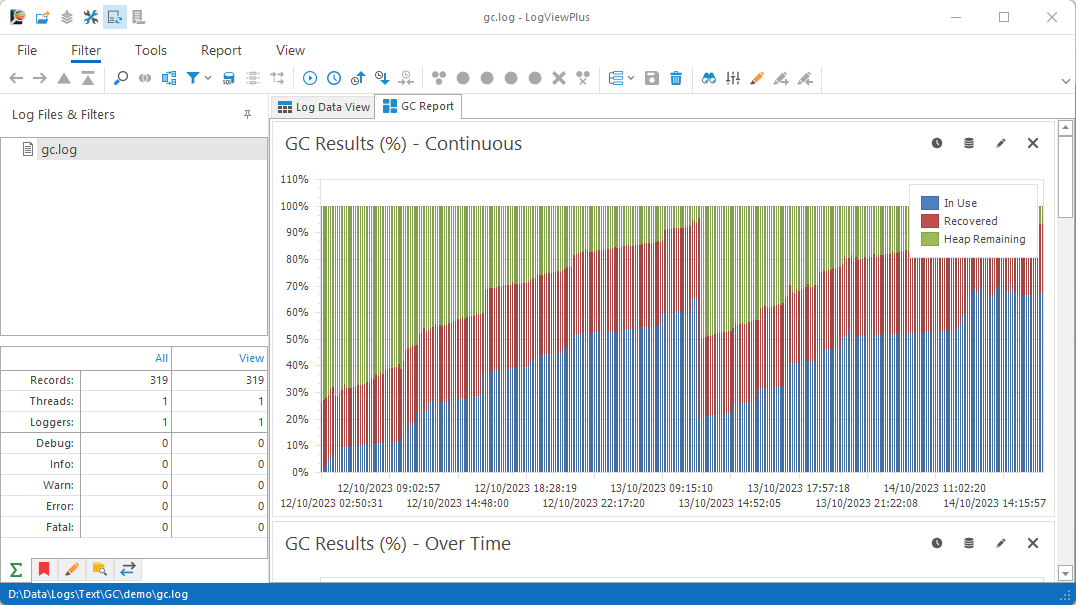
Java GC Event Overview
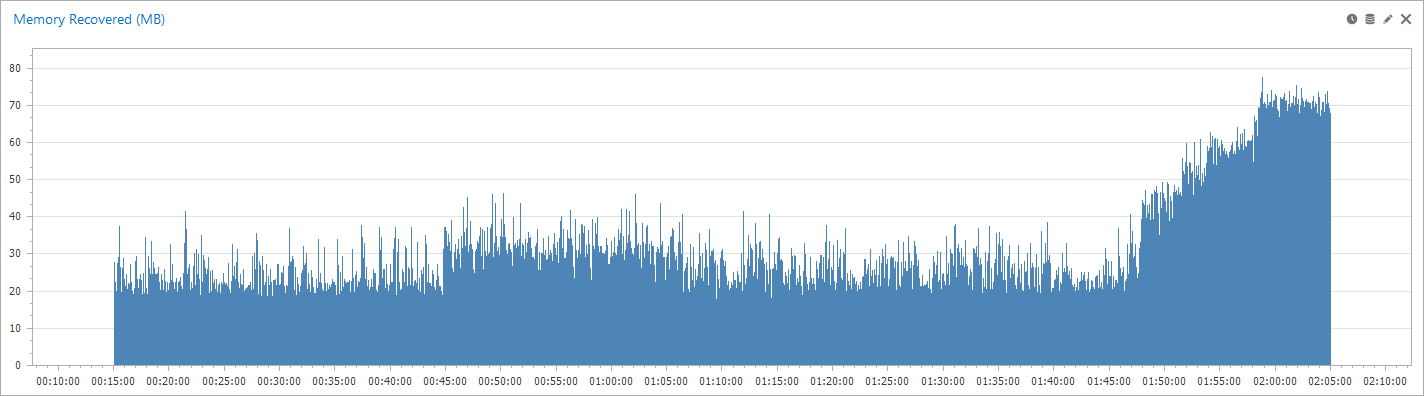
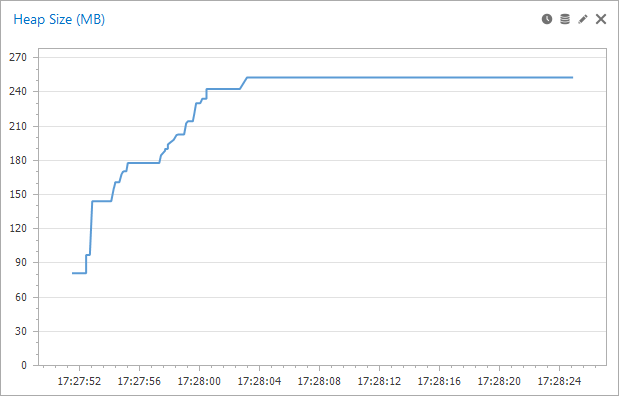
The first report you will see after opening a Java GC log file is an overview of all the GC collection events. Events are divided into three parts, memory in use, memory recovered, and the size of the heap.
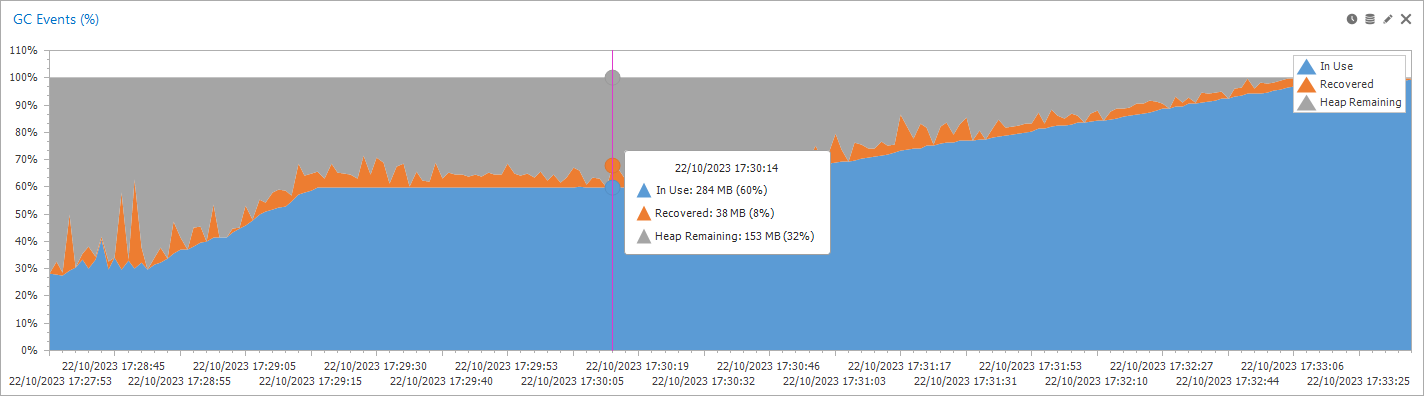
We also show the same data as a report over time. The over-time version of the report clearly indicates gaps in time where GC collection events were more or less frequent. Together, these two reports can explain a lot of activity and help you identify issues faster.
Basic GC Analysis
SELECT Timestamp,
     After AS [In Use],
     Before - After AS Recovered,
     CASE WHEN Heap IS NOT NULL -- Heap is known.
        THEN Heap - Before
     WHEN HeapPct IS NOT NULL -- Heap is calculated.
        THEN (Before / (HeapPct / 100)) - Before
     ELSE 0
   END AS [Heap Remaining]
FROM CurrentView
GC Pause Times
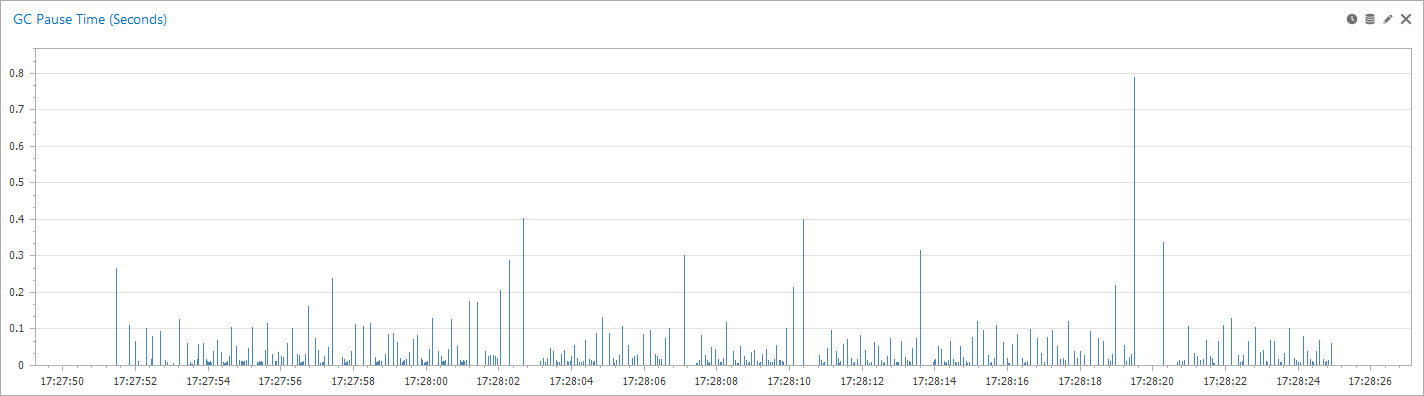
Experienced Java developers know that one of the first things you want to check when investigating poor application performance is the GC logs. LogViewPlus makes this dead easy with a single report which clearly indicates spikes in pause times.
GC Pause Times
SELECT Timestamp,
IsNull(Pause, 0) AS Elapsed
FROM CurrentView
Analyze GC Logs Locally
Why share data with a third party when you can just do it yourself? LogViewPlus analyzes log files locally and does not store data or forward it to another system. We analyze each log file individually. This ensures that our solution is ready out of the box with zero configuration while also providing the flexibility you need to adapt to new requirements.
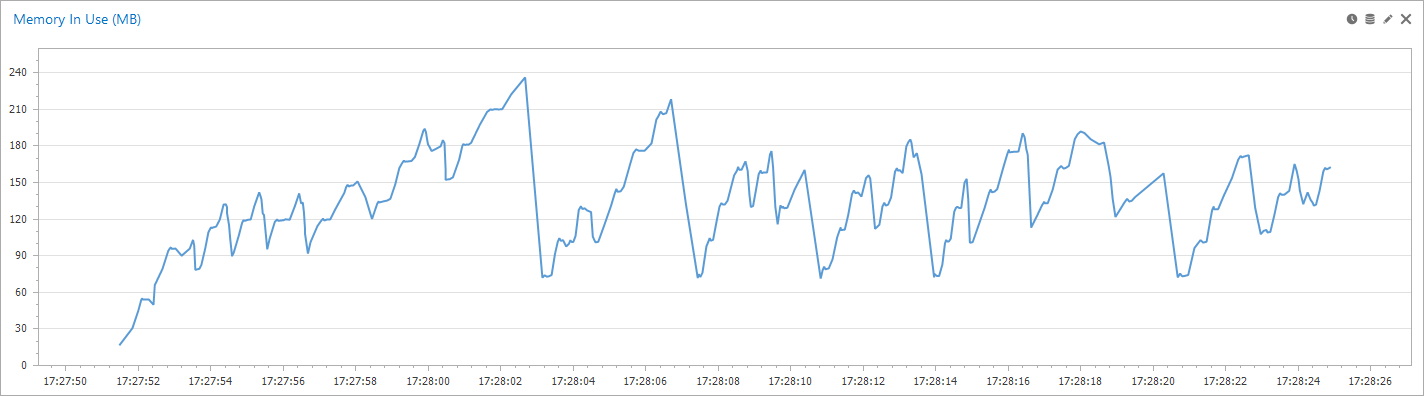
Application Memory In Use
SELECT Timestamp,
Before AS [Used]
FROM CurrentView
Flexible GC File Parsing
Java GC log files are a bit unusual because the GC algorithm controls the log file format which can very widely. LogViewPlus can adapt automatically to algorithm changes by using advanced regular expressions. We support Serial GC, Parallel GC, CMS GC, G1 GC, Z GC and Shenandoah GC with more support coming soon.
GC Memory Recovered
SELECT Timestamp,
Before - After AS Recovered
FROM CurrentView
Explore with SQL
LogViewPlus uses a custom SQL engine based on Transact-SQL which makes it is easy to transform your data. The SQL engine works with the parsed log entry data already in memory. So query execution is super fast while avoiding the need to put your data into another system. Fast query execution based on a standard query language makes LogViewPlus a great tool for exploring your logs to gain new insight.
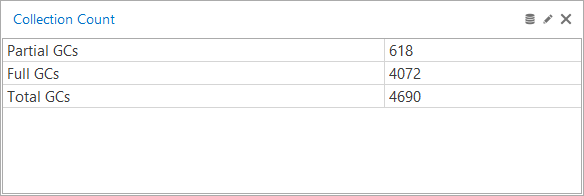
GC Collection Types
SELECT
    COUNT(CASE
        WHEN Message NOT LIKE '%Full GC%' THEN 1
    END) AS [Partial GC],
    COUNT(CASE
        WHEN Message LIKE '%Full GC%' THEN 1
    END) AS [Full GC],
    COUNT(*) AS [Total GCs]
FROM CurrentView
Heap Size
SELECT Timestamp, Heap
FROM CurrentView
Best of all, you are in control.
LogViewPlus has some prebuilt reports, but these are just the start. With custom SQL and quick charting built-in, you can explore your Java GC files any way you want. Check out our documentation for more information about creating custom reports.
Plus tons of other useful features!
LogViewPlus can help you with a lot more than just Java GC log files. LogViewPlus is a full featured log file analysis program. Check out some of our other great features in our short video tutorials.

Level up your log files in 2 minutes.
See how we can help you read and analyze log files with our free trial.