IIS Log Analysis
LogViewPlus uses SQL to turn your IIS log file into prebuilt reports. You can also execute custom SQL statements to quickly generate your own reports.

Analyzing an IIS log file in LogViewPlus. (1:41)
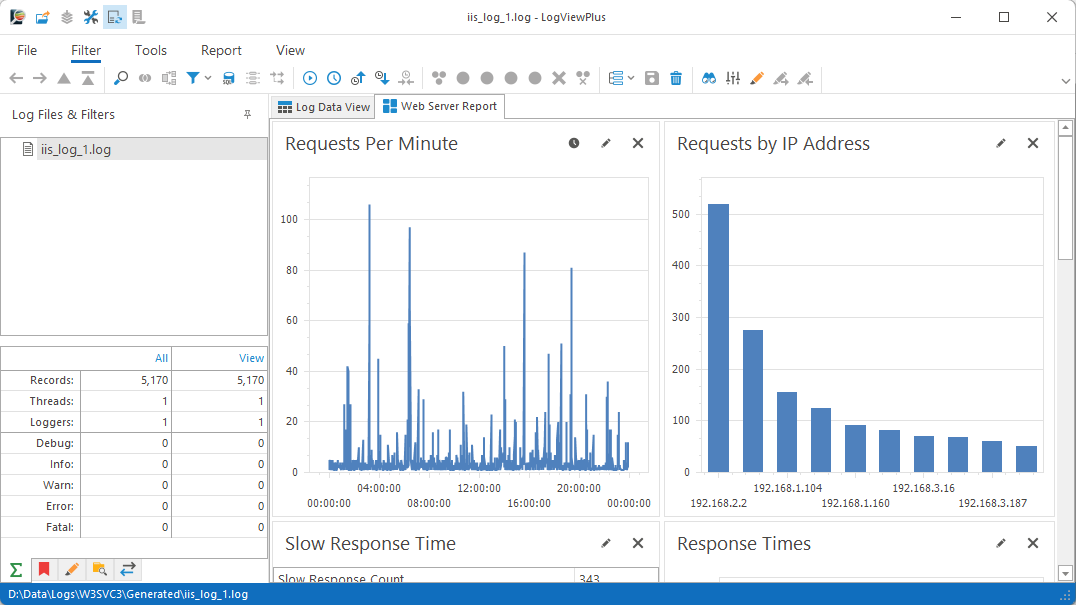
LogViewPlus uses built-in support for IIS log files to generate SQL based reports showing users over time, average response times, result code aggregation and more. Do you use a different web server like Apache? No problem. It's easy to create custom reports from any log file.
Direct Log File Analysis
LogViewPlus does not store data or forward it to another system. We analyze each log file individually. This ensures that our solution is ready out of the box with zero configuration while also providing the flexibility you need to adapt to new requirements. If you need to analyze data across a time range that exceeds a single file, LogViewPlus can merge your log files into a single view. All reports will update automatically as the view changes.
Peak Traffic by Hour
SELECT DATEPART(hour, [Timestamp]) AS Hour,
COUNT(*) AS Requests
FROM CurrentView
GROUP BY DATEPART(hour, [Timestamp])
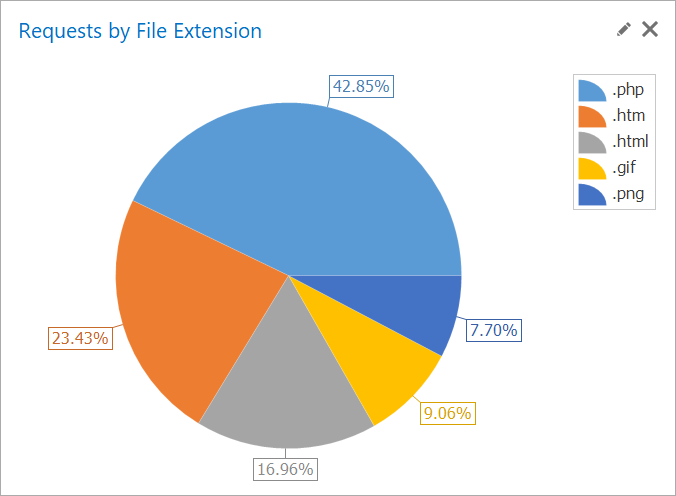
ORDER BY Requests DESCRequests by File Extension
SELECT TOP 5
	GetFileExtension(cs-uri-stem) AS Extension,
	COUNT(*) AS Hits
FROM CurrentView
WHERE NOT (IsNull(GetFileExtension(cs-uri-stem), '') = '')
GROUP BY Extension
ORDER BY Hits DESC
Explore with SQL
LogViewPlus uses a custom SQL engine based on Transact-SQL which makes it is easy to transform your data. The SQL engine works with the parsed log entry data already in memory. So query execution is super fast while avoiding the need to put your data into another system. Fast query execution based on a standard query language makes LogViewPlus a great tool for exploring your logs to gain new insight.
Error Status Codes
SELECT TOP 5 sc-status,
sc-substatus, sc-win32-status,
COUNT(*) AS ErrorCount
FROM CurrentView
WHERE sc-status NOT LIKE '2%'
GROUP BY sc-status, sc-substatus, sc-win32-status
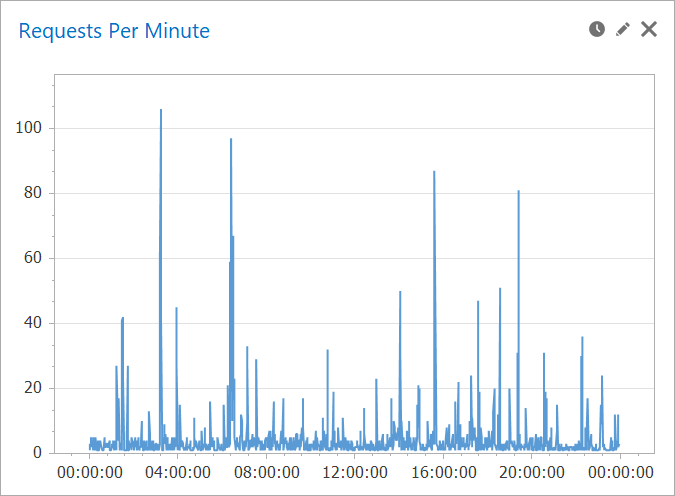
ORDER BY ErrorCount DESCRequests Per Minute
SELECT CAST(Timestamp AS smalldatetime) AS Time,
	COUNT(*) AS Entries
FROM CurrentView
GROUP BY CAST(Timestamp AS smalldatetime)
ORDER BY Time
Report Dashboards
Dashboards are a way to group multiple reports into the same view. They are a great way to visualize a diverse set of data and quickly understand what your logs are telling you. Multiple chart types are supported including bar, pie, line, point, and area as well as stacked charts. You can also display data in a grid which works great when the data can be neatly summarized in SQL. With dashboards, you can go from SQL statement to chart in a few seconds.
Most Active Users with Reverse DNS
SELECT REVERSEDNS([c-ip]) AS Name,
[c-ip] AS Machine, Hits
FROM (
SELECT TOP 5 [c-ip], COUNT(*) AS Hits
FROM CurrentView
GROUP BY [c-ip]
ORDER BY Hits DESC
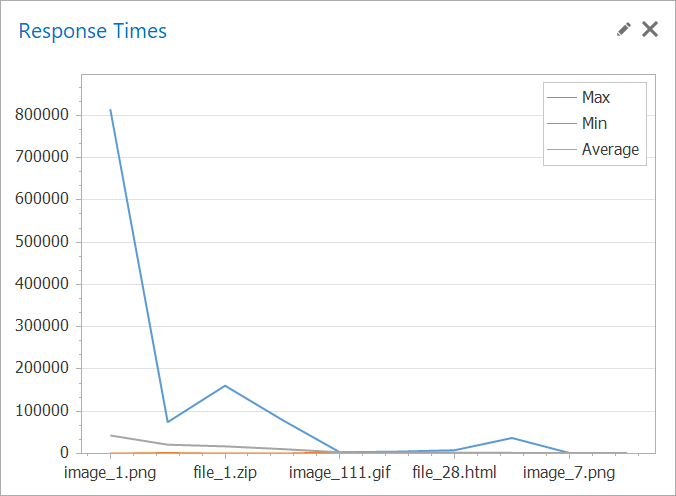
)Response Times
SELECT TOP 10
    cs-uri-stem AS URL,
    MAX(time-taken) AS Max,
    MIN(time-taken) AS Min,
    Avg(time-taken) AS Average
FROM CurrentView
GROUP BY URL
ORDER By Average DESC
Merging & Filtering
SQL reports are fully integrated with other LogViewPlus features. For example, you can open multiple files in LogViewPlus and merge them into a single view. This allows you to import more data and expand your reports on demand. Another example is filtering. Filtering is like searching in LogViewPlus with each filter creating a separate view. When the view changes, your reports update automatically. This is kind of like adding WHERE clauses on to your SQL statements, but much more dynamic.
Most Active Users with Reverse DNS
SELECT TOP 5 COUNT(DISTINCT [c-ip]) AS UniqueVisitors,
[cs-uri-stem]
FROM CurrentView
GROUP BY [cs-uri-stem]
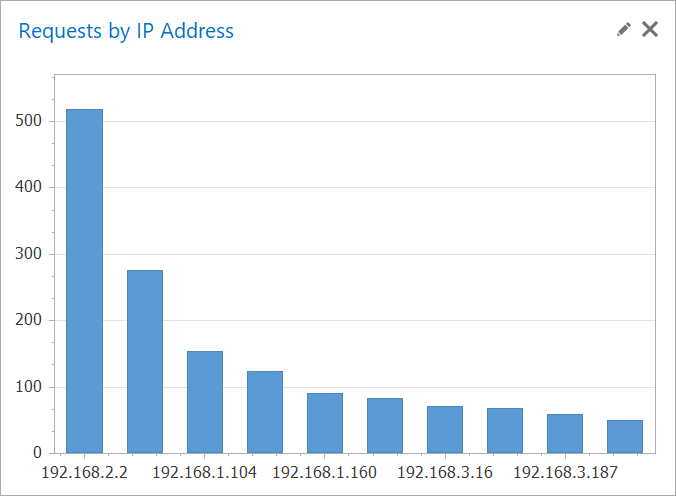
ORDER BY UniqueVisitors DESCRequests by IP Address
SELECT TOP 10 c-ip  AS  Machine,
	COUNT(*)  AS  Requests
 FROM CurrentView
 GROUP BY Machine
 ORDER BY Requests DESC
Best of all, you are in control.
LogViewPlus has some prebuilt reports, but these are just the start. With custom SQL and quick charting built-in, you can explore your data any way you want. Check out our documentation for more IIS log analysis SQL statements.
SELECT TOP 5 [cs-username],
	[c-ip], COUNT(*) AS FailedLoginAttempts
FROM CV
WHERE sc-status = '401'
GROUP BY [cs-username], [c-ip]
ORDER BY FailedAttempts
Plus tons of other useful features!
LogViewPlus can help you with a lot more than just IIS log files. LogViewPlus is a full featured log file analysis program. Check out some of our other great features in our short video tutorials.

Level up your log files in 2 minutes.
See how we can help you read and analyze log files with our free trial.