Thanks for the sample log entries.
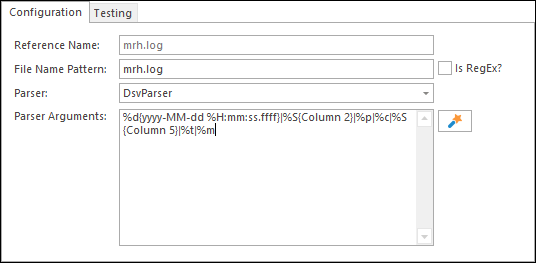
If I put these log entries together, LogViewPlus opens the file with a default parse of:
%d{yyyy-MM-dd %H:mm:ss.ffff}|%S{Column 2}|%p|%c|%S{Column 5}|%t|%mThis is using the DsvParser:
That looks good to me and it leaves us with messages similar to the ones you defined in your original post. The next step is to
parse the messages individually.
The first message can be parsed with:
BIGFOOTDATACONNECTION - %S EvtFmBytes:%s{EvtFmBytes} HWEvents:%s{HWEvents} %S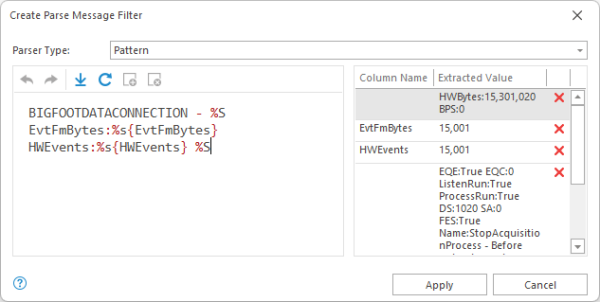
Breaking this down...
BIGFOOTDATACONNECTION - quickly identifies which messages I am looking for (this helps improve performance).
%S - reads and ignores data until it finds...
EvtFmBytes:%s{EvtFmBytes} - our
first column.
HWEvents:%s{HWEvents} - our second column.
%S - finally, we read until the end of the message.
TIP: When defining the
%S data to ignore, I just highlighted the data to ignore and selected 'Mark as Custom' without supplying a column name. The named columns were also defined using the 'Mark as Custom' command.
The second message uses the format:
SystemHealthTriggerSnapshot - %S CPU:%s{CPU} %S Client:%S{ClientCPU}/%s{ClientMem}MB Server:%S{ServerCPU}/%s{ServerMem}MB %SThe parsing technique here is very similar to the first message, so hopefully the configuration makes sense.
So, that's how to parse the messages, the next step is to query them with SQL. Here, I ran into a problem with the BIGFOOTDATACONNECTION message. For some reason, LogViewPlus doesn't like the data values. I think it is struggling to convert the number format. This is a bug which we will be sure to address in the next release. Apologies for this - SQL parsing is new.
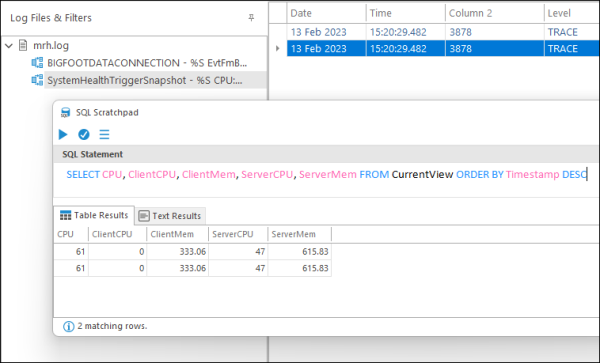
The second message can be queried successfully with:
SELECT CPU, ClientCPU, ClientMem, ServerCPU, ServerMem FROM CurrentView ORDER BY Timestamp DESC
When querying, note that you must select a view which provides the necessary columns. I have duplicated your data in my test log file, so the end result is something like:
Hope that helps,
Toby