Graph Reports - Cursur Tooltip Resolution

Posted on Sep 8, 2021 at 7:36 PM
Hi Toby,

when I have Log entries that span several months and I use the "Graph Reports" the cursor tooltip only shows the month, but not the day (or hours or minutes).
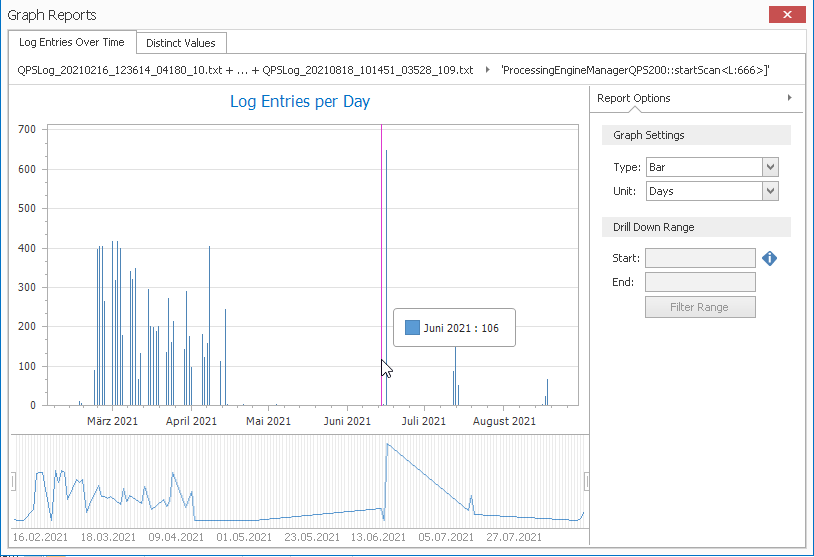
To find the time when some log entries start or stop it would be helpful for the cursor to display more time details than the x-axis.

Regards
Andreas

Posted on Sep 9, 2021 at 5:53 AM
Hi Andreas,

Thanks for bringing this issue to our attention.  I can see that better tool tip resolution would help in some instances.  This is something we can review in a future release.

For now, I would recommend one of two approaches: either make the form bigger or use the timeline below the graph to select a time range.  These approaches should give the chart enough room to effectively draw the X axes.  

Hope that helps,

Toby

This topic is closed and cannot receive new replies.