Posted on Mar 29, 2022 at 6:59 AM
Thanks for the sample log file - that is always very helpful. :-)
I have updated your post to remove the link for now. For anyone else reading this thread, the important thing to note is that the file is a 1 GB text file with JSON data.
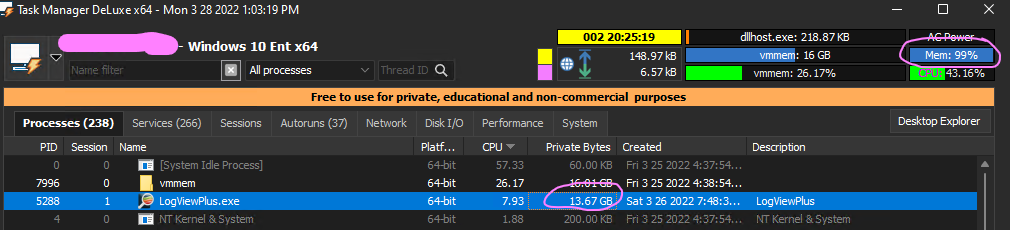
On my machine, this file is running in line with expectations and consuming about 3.7 GB of memory:

I agree there is some inefficiency here. This is something that we have spent a lot of time investigating and trying to improve, but the bottom line is that:
1. Converting from ASCII or (most) UTF-8 to UTF-16 is required by the .Net framework and will double the memory size.
2. Keeping a parsed and unparsed version is necessary to support different filter and analysis scenarios supported by the application.
LogViewPlus has been using the same memory model for a few years. There have been some updates to the application which should enable some changes which would dramatically improve the memory profile for most users. Unfortunately, these changes are still several months out.
Back to the problem: Why am I showing 3.6 GB and you are showing 13.6 GB? I can think of two possible reasons:
1. The application may have had several files open prior to opening this log file. LogViewPlus uses string interning, which means that not all memory is cleaned up after a log file is closed. Normally, this is not an issue, but problems can arise if users are opening multiple large files. We can look into disabling this in the next release.
2. Because this is a JSON file with lots of small bits of data, there is a lot of memory used during parsing. This usage should be reclaimed after the file is loaded. Maybe garbage collection is not running correctly for some reason? Garbage collection is triggered by the OS and not the application. Sometimes the OS can make "strange" decisions about when to try and collect.
As an interim solution, I would recommend either restarting LogViewPlus as it reaches the memory threshold or looking into
Partial Opens.
Hope that helps,
Toby