Hi
I have restarted the viewer and this happens after a few minutes every time.
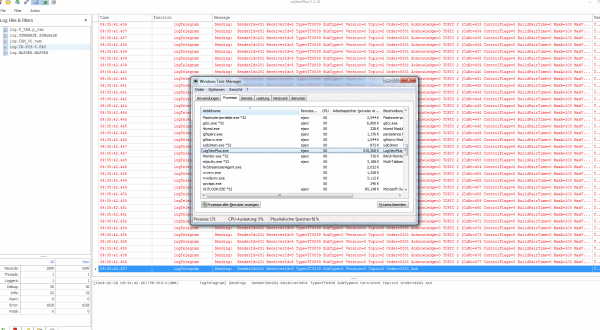
I have taken a screenshot before and after the memory leak. In this example memory usage was "only" 519MB though, but it doesn't seem right anyway. I tried this with version 2.2.16 but I will install the new version and try it again. Are there any debug files I could provide ?
The strange thing I noticed is that the value does not increment to that 519MB, it jumps back and forth from 519MB to 22MB.
I had 5 logfiles open. They all had a max file size of 1MB.
EDIT: I noticed that when the memory usage is high, and I select the logview window, the memory usage stays the same, but after I select another window the usage immediatly drops down to normal values. It rises again to the high values after a few minutes.
EDIT2: Opened another logfile and mem usage climbed to about 10GB. It climbed with about 100MB a second till the 10gb, then I focused the log viewer and then another window, it dropped down and started climbing again immediately.
thanks
regards
Erich