Distinct Values
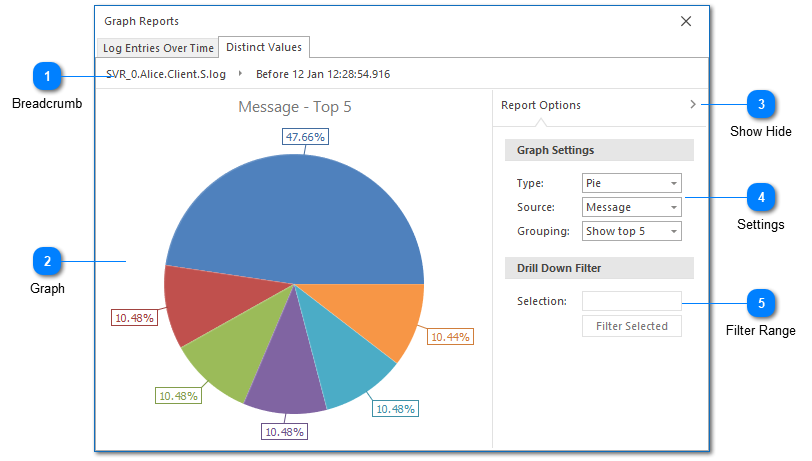
The distinct values report is used to group the common values found in a given column. For example, you can use this report to find the thread or logger which produced the most log entries in the current view.
The values contained in the message column is treated a little bit differently from other columns. For messages, LogViewPlus will generate a template which attempts to extract any variable data from the core message. When creating a template, LogViewPlus will substitute out any numeric values or values contained between brackets.
Functionally, the distinct values report is very similar to the log entries over time report. The data used by the Distinct Values report is always provided by the current view.
Breadcrumb
The breadcrumb navigation is used to manipulate the filter tree. Modifying the breadcrumb navigation changes the selected filter which will automatically update the report.
Graph
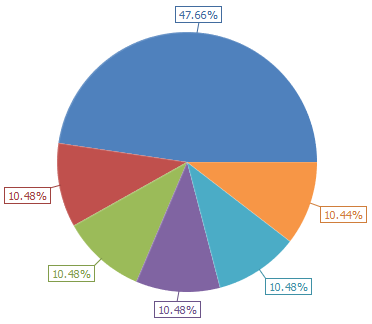
The graph area shows the currently selected graph drawn according to the graph settings provided. Hovering over the graph will display information about the currently selected data point. In this case, a description of the value identified along with statistical information regarding its commonality.
You can double-click a graph element to automatically create a filter based on the selected value.
A legend will automatically be show in the graph if the window width allows.
Clicking on a graph element will populate the drill down filter (discussed below).
Show Hide
You can show or hide the graph settings by clicking on the report options title. This is helpful when you want to provide more room to draw the graph.
Settings
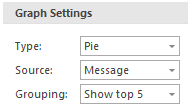
The distinct values report can be displayed as either a pie or bar chart.
You can also change the source column to report on data from different parts of the view.
Finally, you can change the number of values to be grouped. Values which fall outside of the group number will automatically be categorized into an 'Other' category. You can filter on the 'Other' category to find more information about its constituents.
Changes to graph settings will be applied automatically.
Filter Range
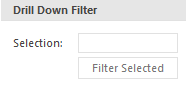
LogViewPlus can create a Text Filter from the selected chart element. The text filter will automatically be applied specifically to the column currently being analyzed.