Dashboard Report
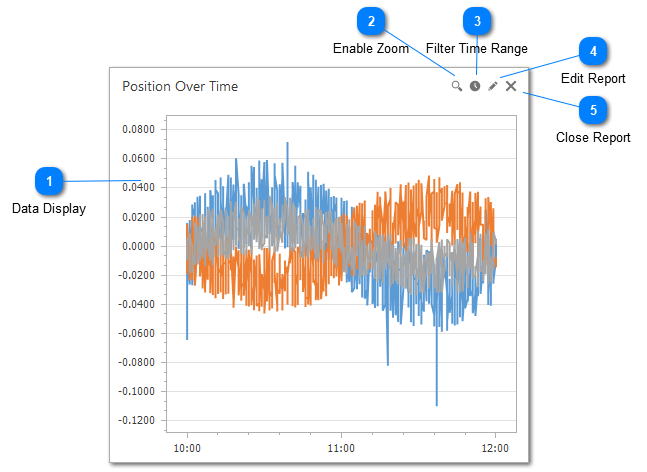
A dashboard is made up of one or more reports. Reports in LogViewPlus are generated by applying a SQL SELECT statement to the currently selected view. This is done by using the Dashboard Report Wizard which is available from the Report Toolbar.
Dashboards organize report items into a table with rows and columns. Report items are inserted into the table with a variable column and row span that allows you to customize how the dashboard is displayed. Dashboard tables are made up of 16 columns. These columns form 100% of the dashboard table width. Rows are sized at 100 pixels per row, depending on your screen DPI settings. A dashboard can contain an unlimited number of rows. The vertical scrollbar will be inserted automatically if needed.
You can drag-and-drop report items in a dashboard to move a report from one area to another. When moving report items the source and destination must be size compatible. Generally this means that both the source and destination have the same column and row span.
Because report data is gathered from the SQL SELECT statement, the information displayed in a report is very flexible. LogViewPlus supports a full range of SQL SELECT commands including data aggregation and manipulation.
LogViewPlus automatically handles complex datasets to ensure your dashboards remain readable:
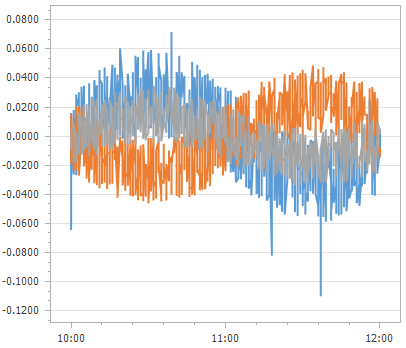
Multiple Time Series: If your SQL query returns multiple value columns, LogViewPlus will automatically plot a separate line or bar series for each column on the same chart.
Secondary Y-Axis: When displaying multiple series with drastically different value ranges (such as requests per minute vs. average response time), LogViewPlus will auto-detect the discrepancy and add a secondary Y-Axis. A secondary axis is created automatically if the median values vary by more than 10x.
Zoom & Pan: To inspect a narrow time range or specific data spikes, you can freely zoom and pan your charts. Hold Ctrl + Scroll over the chart area to zoom, or simply toggle the Zoom padlock button located in the chart header. Once zoomed in, you can click and drag to pan.
Smart Point Sizing: For point and scatter plots, LogViewPlus dynamically adjusts the marker size based on data density, preventing charts with thousands of data points from looking cluttered.
Dynamic Precision Hover: Tooltips displayed when hovering over points will intelligently adjust their decimal precision to show up to five decimal places when inspecting fractions of a value.
Data Display
The data display area shows the result of applying the data in the current view with a SQL statement and the selected report type. Multiple report types are supported including data grids, pie charts, and bar graphs.
Enable Zoom
Hold Ctrl + Scroll over the chart area to zoom, or simply toggle the Zoom button. Once zoomed in, you can click and drag to pan.
Filter Time Range
For charts with a timestamp on the X-axis, you can optionally apply a date time filter visually. This command will open a new window with two split bars at the bottom. By dragging the bars on the left and right, you can define a time range while visually checking chart. This allows you to filter visually interesting data.
Edit Report
Editing the report allows you to revisit report settings such as the SQL statement used, column and row span, or even the report type.
Close Report
Closing a report will remove it from the dashboard. Once the report is closed it cannot be recovered.