Dashboard Overview
The dashboard view is highly customizable to fit your needs. By default, charts are arranged on two rows. However, you can add as many chart rows as you require - the dashboard will effortlessly scroll vertically. Furthermore, you can control the vertical footprint of individual charts using the Row Span property, making it easy to emphasize critical data visualizations alongside smaller supporting reports.
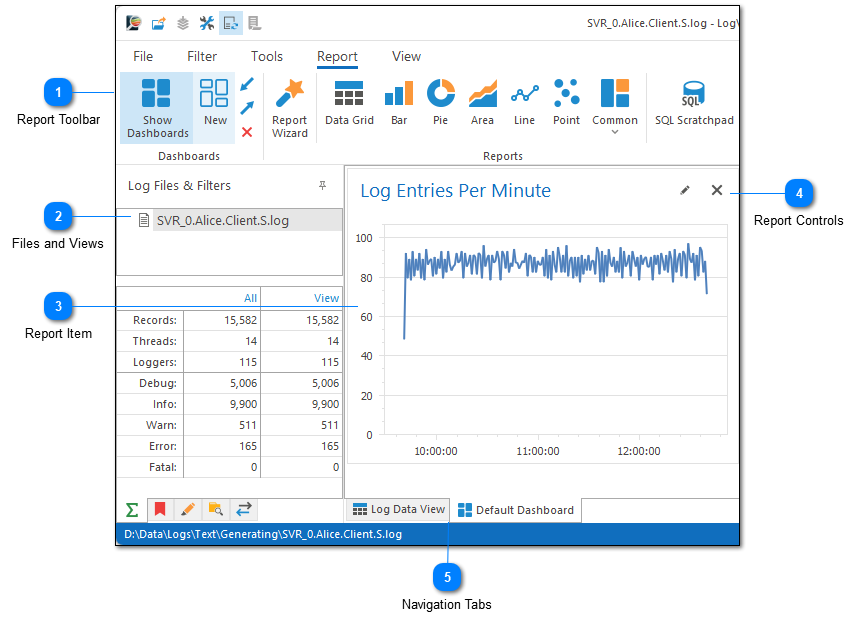
Before we dive into the details, let's just take a quick look at our dashboard view.
Report Toolbar
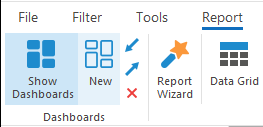
The Report Toolbar was discussed in the previous chapter. Use the report toolbar to manage dashboards and create new reports.
Files and Views
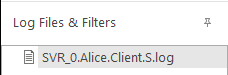
On the far left of the screen is a tree list which shows all of the files and views you currently have open. You can use this list to navigate between log files and filter results. LogViewPlus uses the same log filter tree structure to navigate both data and dashboards.
Changing the view will automatically update the current dashboard. This means that any SQL statements used when generating a report should not attempt to filter data in the where clause. Data filtering can be achieved by creating filtered view on the log data and this can make your reports more flexible.
Report Item
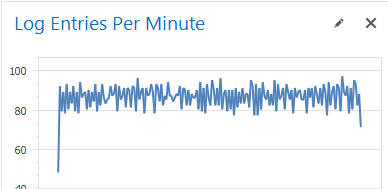
The report item typically shows a graph of data retrieved from a SQL select statement. Multiple types of graphs are supported and you can even display the data directly in a grid.
Dashboards can contain multiple report items.
Report Controls
In the upper right corner of the report item you will find the report commands. Report commands can be used to edit or remove a given report.
Navigation Tabs
If dashboards are currently enabled, you will see a minimum of two tabs at the bottom of the LogViewPlus window. These tabs can be used to navigate between the log entry grid and a given dashboard. Multiple dashboards may be assigned to the same log file configuration. In which case, more than two tabs will be shown.
The first tab will always be the log data view. Selecting this tab will show the Log Entry Grid and the underlying data used to populate your dashboard reports.