Report
![Report](https://az589779.vo.msecnd.net/images/doc08/drex_report_screen.png)
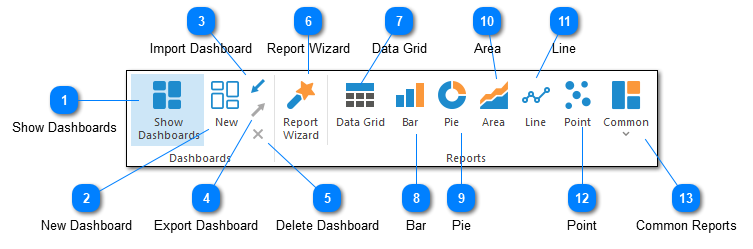
The Report toolbar is used to manage dashboards and create new dashboard reports.
![1](https://az589779.vo.msecnd.net/images/doc08/drex_bullet_1.png)
Show Dashboards
![1. Show Dashboards](https://az589779.vo.msecnd.net/images/doc08/drex_report_control_1.png)
The Show Dashboard command toggles whether dashboards should be displayed or hidden for the currently selected log file. If dashboards are displayed, they will appear as tabs next to the Log Data View tab at the bottom of the Log Entry Grid.
All other commands on the Report toolbar will be enabled only if dashboards are currently displayed.
![2](https://az589779.vo.msecnd.net/images/doc08/drex_bullet_2.png)
New Dashboard
![2. New Dashboard](https://az589779.vo.msecnd.net/images/doc08/drex_report_control_2.png)
Creates a new dashboard tab. You will be prompted to provide a name for the new dashboard.
![3](https://az589779.vo.msecnd.net/images/doc08/drex_bullet_3.png)
Import Dashboard
![3. Import Dashboard](https://az589779.vo.msecnd.net/images/doc08/drex_report_control_3.png)
Imports a previously exported dashboard (see below).
![4](https://az589779.vo.msecnd.net/images/doc08/drex_bullet_4.png)
Export Dashboard
![4. Export Dashboard](https://az589779.vo.msecnd.net/images/doc08/drex_report_control_4.png)
Saves the currently selected dashboard to a file for later import (see above). Exported dashboards can be shared.
![5](https://az589779.vo.msecnd.net/images/doc08/drex_bullet_5.png)
Delete Dashboard
![5. Delete Dashboard](https://az589779.vo.msecnd.net/images/doc08/drex_report_control_5.png)
Deletes the currently selected dashboard.
![6](https://az589779.vo.msecnd.net/images/doc08/drex_bullet_6.png)
Report Wizard
![6. Report Wizard](https://az589779.vo.msecnd.net/images/doc08/drex_report_control_6.png)
Launches the Dashboard Report Wizard which can be used to produce any type of report. Several commands in Report dashboard rely on the Dashboard Report Wizard and simply load the Wizard directly in the required state. For example, the Bar command is simply the Report Wizard with the chart type decision predefined.
![7](https://az589779.vo.msecnd.net/images/doc08/drex_bullet_7.png)
Data Grid
![7. Data Grid](https://az589779.vo.msecnd.net/images/doc08/drex_report_control_7.png)
Create a new data grid report to show SQL query results as text in a grid.
![8](https://az589779.vo.msecnd.net/images/doc08/drex_bullet_8.png)
Bar
![8. Bar](https://az589779.vo.msecnd.net/images/doc08/drex_report_control_8.png)
Create a new bar chart.
![9](https://az589779.vo.msecnd.net/images/doc08/drex_bullet_9.png)
Pie
![9. Pie](https://az589779.vo.msecnd.net/images/doc08/drex_report_control_9.png)
Create a new pie chart.
![10](https://az589779.vo.msecnd.net/images/doc08/drex_bullet_10.png)
Area
![10. Area](https://az589779.vo.msecnd.net/images/doc08/drex_report_control_10.png)
Create a new area chart.
![11](https://az589779.vo.msecnd.net/images/doc08/drex_bullet_11.png)
Line
![11. Line](https://az589779.vo.msecnd.net/images/doc08/drex_report_control_11.png)
Create a new line chart.
![12](https://az589779.vo.msecnd.net/images/doc08/drex_bullet_12.png)
Point
![12. Point](https://az589779.vo.msecnd.net/images/doc08/drex_report_control_12.png)
Create a new chart showing series data points.
![13](https://az589779.vo.msecnd.net/images/doc08/drex_bullet_13.png)
Common Reports
![13. Common Reports](https://az589779.vo.msecnd.net/images/doc08/drex_report_control_13.png)
Common reports are predefined reports that can be used with most parsed log files. Currently, the predefined report are:
- Log Entries Per Minute
- Distinct Message Types
- Log Level Distribution
- Most Active Loggers
- Issues by Logger
Common reports are a great way to get started with dashboards. Try creating and editing a common report as a way to learn more about how Reports & Dashboards work in LogViewPlus.