Dashboard Report Wizard
The Dashboard Report Wizard is used to add a new report to the dashboard, or edit an existing report. This dual functionality means it provides the core functionality required by LogViewPlus dashboard reporting.
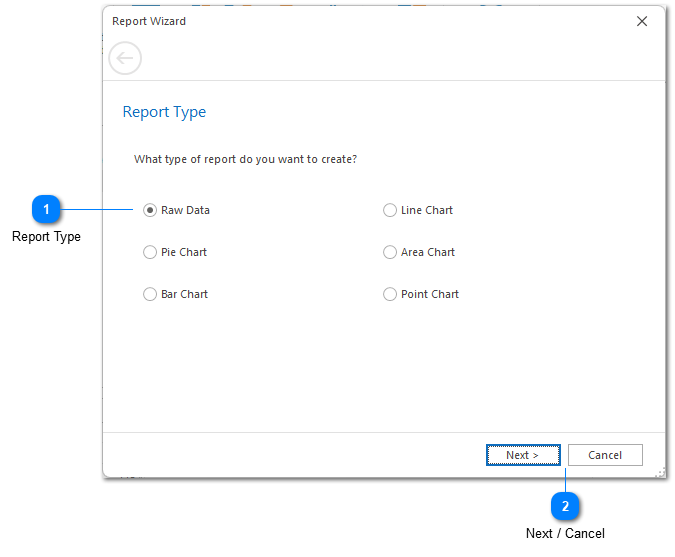
Report Type
The first step in creating a new dashboard report is to select how you want to view the data. This determines the type of chart that will be needed by the Report Wizard.
LogViewPlus currently supports six different chart types: raw data, pie chart, bar chart, line chart, area chart and point chart.
Next / Cancel
The Next button progresses the Report Wizard to the Report SQL Query stage.
The Cancel button exits the report wizard. Changes will not be saved.