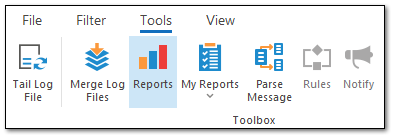
Navigation Reports

LogViewPlus can parse your log files and transform the data into information which can then be exported to a CSV file or HTML.
As you work with the information displayed in LogViewPlus you may find it helpful to see the information displayed as a graph. LogViewPlus can generate graphs based on any log entry view (any log file or filter). These graphs can give you better insight into your application behavior.
The graphs can also be used to further filter the data. Using the LogViewPlus Graph Reports to generate filters to further subdivide and analyze your log files can be a powerful tool.
Currently, LogViewPlus supports to main graph types: Log Entries Over Time and Distinct Values.