Additional Settings
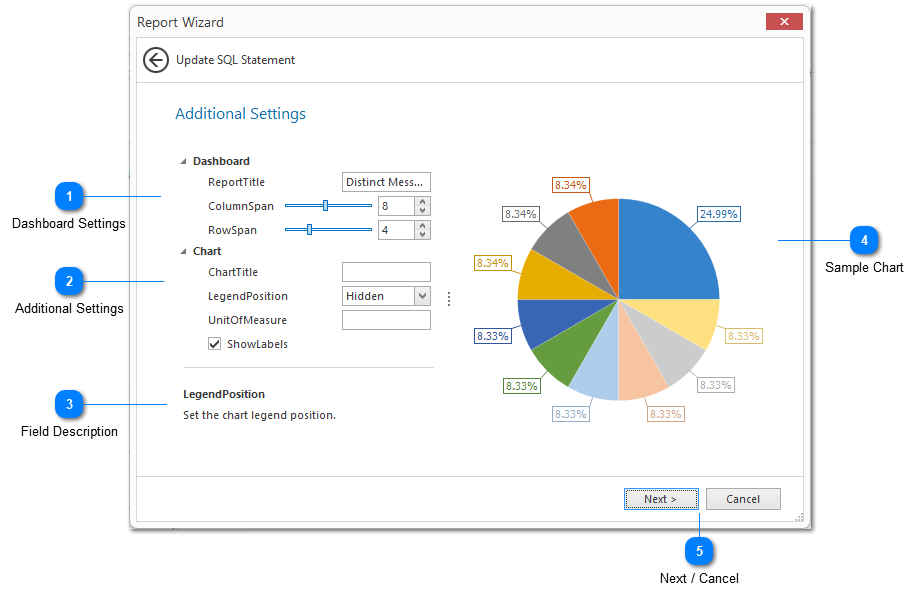
The final stage in creating or editing a report is to apply the report settings. Report settings are all optional but they give you a great deal of control over how your report should be displayed.
Dashboard Settings
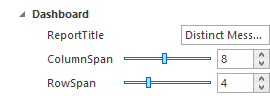
The dashboard settings are used to determine how your report should be displayed within the dashboard. Dashboard settings are common across all report types. For example, you can provide a dashboard title to describe your report in the dashboard.
The most important dashboard settings are the row span and column span. These are used to determine the size of your report within the dashboard.
Dashboards organize report items into a table with rows and columns. Report items are inserted into the table with a variable column and row span that allows you to customize how the dashboard is displayed. Dashboard tables are made up of 16 columns. These columns form 100% of the dashboard table width. Rows are sized at 100 pixels per row, depending on your screen DPI settings. A dashboard can contain an unlimited number of rows. The vertical scrollbar will be inserted automatically if needed.
You can drag-and-drop report items in a dashboard to move a report from one area to another. When moving report items the source and destination must be size compatible. Generally this means that both the source and destination have the same column and row span.
Additional Settings
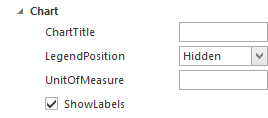
The additional settings area provides optional settings which are specific to the report type you have selected. Use the Field Description (discussed below) to find out more about a specific setting.
Field Description
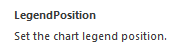
The field description displays context-sensitive help on all report settings. To see a description of any field, simply select the field by clicking on it. The field description will change as the window focus changes.
Sample Chart
The sample chart displays a final version of your chart with all additional settings applied. Note that dashboard settings cannot be visualized in this view.
Next / Cancel
The Next button progresses the Report Wizard to the SQL Drill Down Query stage.
The Cancel button exits the report wizard. Changes will not be saved.