Report SQL Query

Report SQL Query

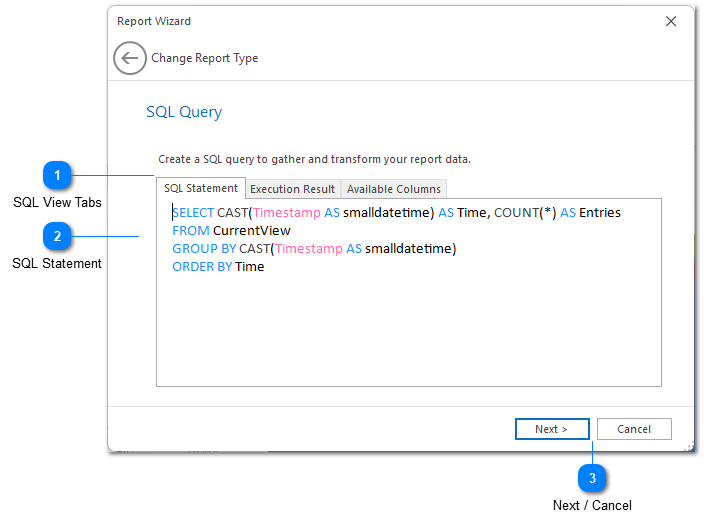
The SQL Query step allows you to create a SQL statement which will be used to gather the data displayed in your report. Find out more about using SQL statements in LogViewPlus.

1

SQL View Tabs

1. SQL View Tabs

The SQL view tabs can help you write your SQL statement. There are three different views:

1.  The SQL Statement tab is an input box where you can write your SQL select statement.

2.  The Execution Result view shows the results you will get when  your SQL statement is executed.  SQL statement execution occurs automatically when this tab is selected.

3.  The Available Columns tab can be used to display the names of the data source columns in the current view.  You can also display the names of the available columns by pressing CTRL+Period in the SQL Statement view.

2

SQL Statement

2. SQL Statement

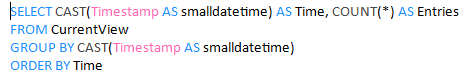
The SQL statement provided here will be used to gather the data to be displayed in your chart. See LVP SQL for more information on the supported SQL syntax.

3

Data Series Type

3. Data Series Type

The data series type is used to configure how the data returned by your SQL statement data should be analyzed.

When transforming data into a chart we need to determine two things. First, we need to know the series data - these are the points to be graphed.  Second, we need to know what to call each set of data series - these names will form the chart legend.

When a SQL statement executes there are basically two ways in which data can be returned. The first and most common approach is to display the data in rows. In this case, data series names will be extracted from the first column and values will be extracted from any subsequent columns. In other words, the data is laid out horizontally. Each row contains a new data series.

The second approach is to display the data in columns, where the column names contain the data series name. Each value in the column will represent a new point in our data series. In other words, the data is laid out vertically. Each column contains a new data series.

4

Flip Axis

4. Flip Axis

Flipping the chart axis will swap the X and Y positions. Note that the chart axis is independent of the data layout returned by your SQL statement.

5

Next / Cancel

5. Next / Cancel

The Next button progresses the Report Wizard to the Report Settings stage.

The Cancel button exits the report wizard.  Changes will not be saved.


< >