Log Entries Over Time
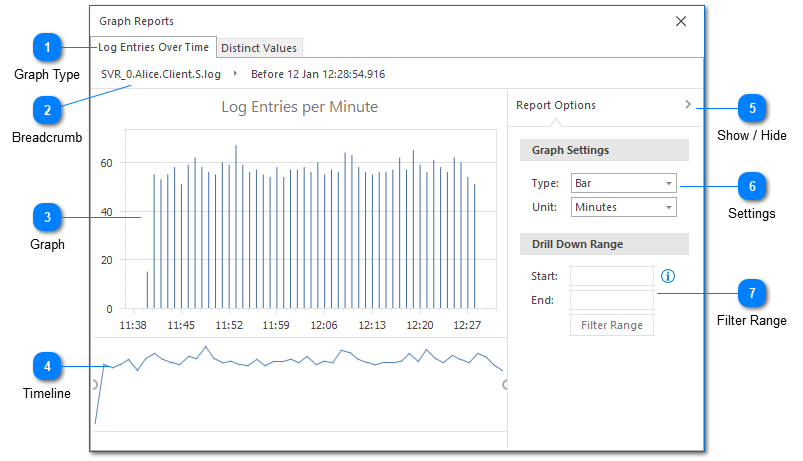
The log entries over time report shows the number of log entries which are contained in the current view at a given time interval. This can be used to better understand how log entries are distributed through the current view.
Graph Type
LogViewPlus supports two primary graph types. The first shows log entries over time. This graph is helpful for giving you a quick feel for how your log entries are distributed over time. The second graph type shows the distribution of values for individual columns. This type of graph can be useful for answering questions such as what is the ratio of debug log entries to error log entries.
Breadcrumb
The breadcrumb navigation is used to manipulate the filter tree. Modifying the breadcrumb navigation changes the selected filter which will automatically update the report.
Graph
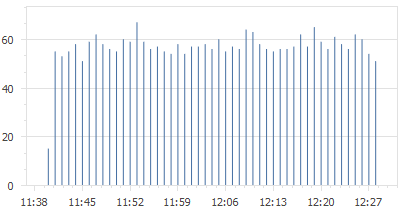
The graph area shows the currently selected graph drawn according to the graph settings provided. Note that hovering over the graph will display information about the currently selected data point. In this case, the number of log entries that were written at a particular point in time.
Timeline
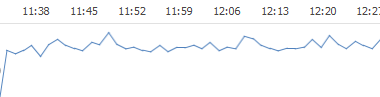
By default the timeline of a graph will be large enough to include all log entries in a view. However, you can use the handle to the left and right of the timeline to narrow the graph down to an area that you find more interesting. The Filter Range command (discussed below) will allow you to create a new Date Time Filter from the selected timeline range. This allows you to drill into the data you find interesting.
Show / Hide
You can show or hide the graph settings by clicking on the report options title. This is helpful when you want to provide more room to draw the graph.
Settings
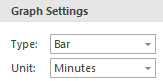
The log entries over time graph can be displayed as either a bar or line chart. We recommend using a bar chart as line charts can sometimes be misleading if data for a particular point in time is not available. In this case, a lined can be drawn through a phantom point.
LogViewPlus will attempt to detect a time unit based on the timestamps contained in the view. However, you can also manually change the time unit.
Changes to graph settings will be applied automatically.
Filter Range
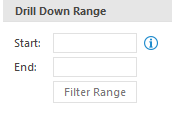
Allows you to create a Date Time Filter for the selected timeline range (discussed above). This helps you find out more about the log entries that were created during the selected time range.