Statistics Grid
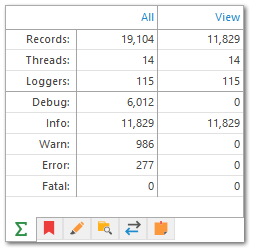
The statistics grid can be used to give you an idea of how many elements are in your log file. It's designed to give you a quick idea of what important information might be available in this log file. The All column represents all statistics on all log entries in the log file. The View column represent statistics on the current view.
Clicking on the column links at the top of the LogViewPlus statistics grid will open the graph log entries dialog for either the log file or the view depending on which link is clicked.
Double-clicking on a row in the statistics grid will bring up a create filter configuration screen with settings relevant to the selected statistic row.