ETW Event Tracing
ETW event tracing is supported in LogViewPlus as an Add-On and can be used to provide access to Microsoft ETW event streams. The ETW Add-On was introduced in LogViewPlus v2.5 and is not supported in earlier versions.
To install the ETW Add-On:
2. Extract the contents of the zip file to the %AppData%\LogViewPlus\Plugins\Etw directory. After the zip file is extracted, the new ETW directory should contain 24 items (two folders and 22 files).
3. Enable plugins and restart LogViewPlus.
LogViewPlus must be run as an administrator in order to access ETW event streams.
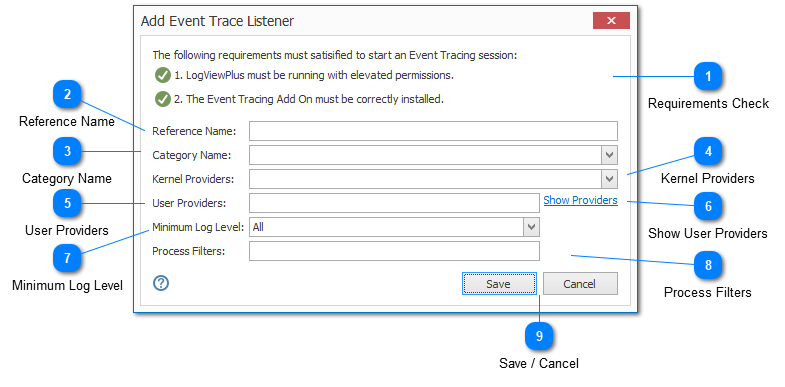
Requirements Check
When adding a new ETW trace listener, you will be presented with a requirements check that will verify all conditions have been met for ETW trace listener execution.
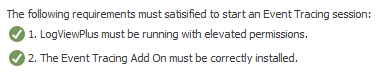
Currently, there are two requirements to execute a trace listener:
1. LogViewPlus must be running with the elevated permissions. This implies either the user or the process is running as administrator.
2. The ETW Add-On should be correctly installed. Installations instructions for the ETW Add-On are discussed above.
The requirements checks are for listener execution only. The ETW listener can be configured even if no requirements have been met. The requirements check is displayed here for information purposes only.
Reference Name
A reference name can be set to more easily manage and access this configuration. Reference names should be unique. Reference names are also be used by the local log level and automatic template settings.
A reference name is required for ETW Listeners.
The name provided will be used to build a URI which can be used to refer to this listener. For this reason, the name provided must be URI friendly - it should not contain characters or symbols which are difficult to represent in URI form.
Category Name
A category name is used to group Syslog connections into a folder in the Log Explorer. This field is not required.
If you have previously configured a server with a category name, this name will be available as a drop-down option. Alternatively you can type a new name into the category text box.
Kernel Providers
If you are interested in monitoring kernel events, you can select them here. The list of available events is adapted from the EVENT_TRACE_PROPERTIES structure.
User Providers
The list of user mode providers to monitor. A list of user mode providers can be found by executing the 'logman' command. See the 'Show Providers' documentation below.
If you want to monitor multiple providers, the provider names should be comma separated.
Show User Providers
Executes the command "logman query providers". The logman command is used to display a list of user providers which are available on the current machine.
Minimum Log Level
The minimum log level you are interested in monitoring. If an event is detected which exceeds the minimum level, it will be discarded.
Process Filters
A comma separated list of process names or task names. If process filters are provided and an event is received with a process or task name that is not in the list of known process filters, the event will be discarded.
This setting allows you to monitor events for a specific process only.
Save / Cancel
Once you have configured your listener, you can use the save command to persist your changes. Once your changes have been saved the configured listener will be immediately available in the folder tree view.
Use the "Cancel" command to return to LogViewPlus without saving your changes.